Managed Availability in Exchange Server 2013
Exchange 2013 introduce a built in monitoring and recovering solution called Managed Availability(MA) which is also known as Active Monitoring or Local Active Monitoring (LAM)
Managed Availability is a built-in self-monitoring and healing functionality in Exchange high availability step. This functionality is responsible for monitoring exchange system and its critical components continuously, if it finds any component is not functioning properly, it performs a self-healing and recovery functions.
Due to the architectural changes in Exchange 2013, it is very important that we should monitor each and every critical component and resolve any issues related to them. Managed Availability is designed in order to address these changes. Managed Availability runs on every exchange 2013 servers, monitors and fixes the issue automatically. In some situations where in Managed Availability cannot fix the issues, it will escalates via event logs.
Components of Managed Availability:
Managed Availability is made up with 3 critical components namely Probes, Monitor and Respond.
The below diagram illustrates the components of Managed Availability:
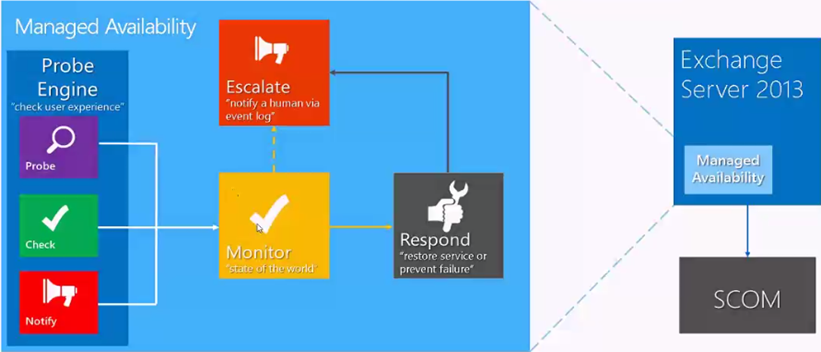
(Courtesy: PPT from TechEd)
Probes Engine:
Probes are defined by each and every
component and their definitions are stored under crimson channel logs. There are 3 categories in probes namely recurrent probes, notifications and checks. Recurrent probes run synthetic transactions performed by the system to test the end to end user transaction. Checks collect performance data including actual customer traffic and measure the collected data against defined threshold to identify if there any issues. Notification logic enables the system to take action immediately based on the events.
Monitors:
A monitor consumes the data collected by probes and determines what action needs to be taken based on a rule set. A monitor can initiate a responder or escalate depending on the rule. It also defines time from failure that a responder is executed and workflow of the recovery action.
Responders:
Responders executes a response to an alert generated by monitor, there are several types of responders as below:
-
Restart Responder : Terminates and restarts service
-
Reset AppPool Responder : Cycles IIS application pool
-
Failover Responder : Takes an Exchange 2013 Mailbox server out of service
-
Bugcheck Responder : Initiates a bugcheck of the server
-
Offline Responder : Takes a protocol on a machine out of service
- Online Responder : Places a protocol on a server back into production
-
Escalate Responder : Escalates an issue
-
Specialized Component Responders
Responders include throttling to provide a built-in sequencing mechanism for controlling responder actions. These throttling ensure that the entire service is not compromised.
All responders are throttled in some fashion, where in some take into account minimum number of servers within a group, account time, account number of occurrences, some may use combination of all. When throttling occurs, responder action may be delayed or skipped.
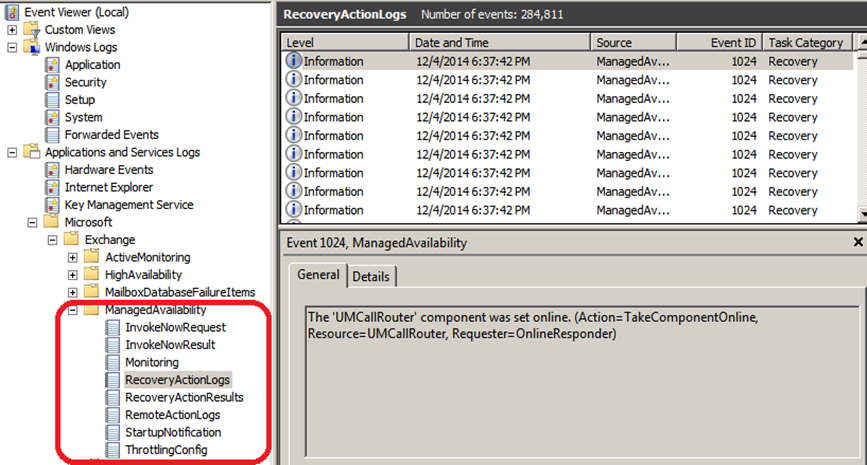
Throttling for a responders is defined in responder definition itself and we can see that actions in recovery action logs as below:
Below diagram illustrates the crimson channel logs for MA:
Managed Availability Pipeline:
We will see how this Managed availability works:
The below diagram illustrates the pipeline of the Managed Availability.
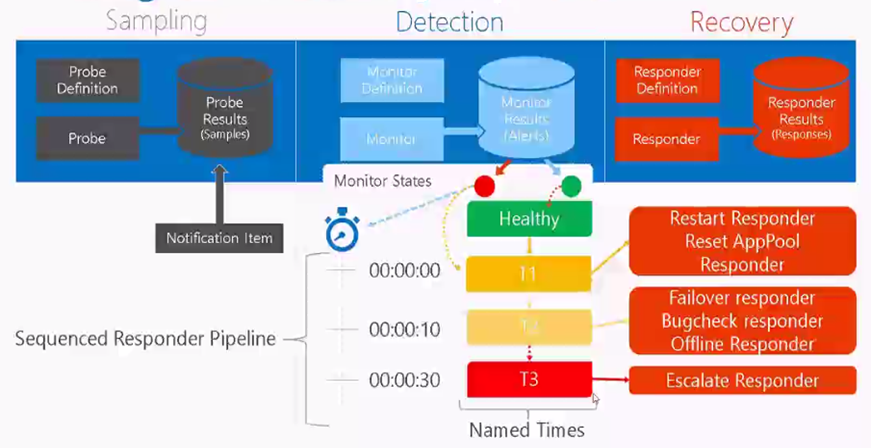
(Courtesy: PPT from TechEd)
We have the Probe definitions which are created by each and every component, and these probe definitions take place when a specific service on exchange server starts i.e. health manager service. With the start of health manager service, the probing function starts and the results of probes will be stored in crimson channel logs. Monitors consume the results from probe and based on the state of probe, the component state will be set to healthy/ unhealthy.
Let us take an example of OWA System: At the starting of the OWA system probes result is healthy. Due to some issue, probes started failing. Monitor finds the sufficient no of probes are failed and turns the state of a specific component to unhealthy. It calls for the first responder (recovery action), and it continues monitoring the probe results. If the issue still not resolved and probes are still failing it will call for next level of responder. Finally if the probes are still failing it calls for an escalate responder which requires a human involvement to resolve/fix the issues.
Architecture of Managed availability:
Managed Availability is executed in the form of 2 processes as below:
Exchange Health Manager Service (MSExchangeHMHost.exe), we can
Exchange Health Manager Worker Process (MSExchangeHMWorker.exe),
NOTE: Another service called MS Exchange Diagnostic service which is not directly responsible, but it helps in collecting performance data which is consumed by Health Manager Service.
Managed Availability make use of persistent storage like, it stores lot of data in Active Directory, Registry use to store runtime data and crimson channel logs used to store work item results.
In Managed Availability, the probes are doing synthetic operations to make sure that they are trying to simulate what an end user does. Apparently a mailbox is required to check these synthetic operations. There are special types of mailboxes created by Managed availability itself called as health mailboxes /monitoring mailboxes under MESO/Monitoring Mailboxes container. The number of monitoring mailboxes is depending on the number of databases on the server. If more no of databases in the system we can see more no of monitoring mailboxes. These mailboxes are managed by the exchange itself.
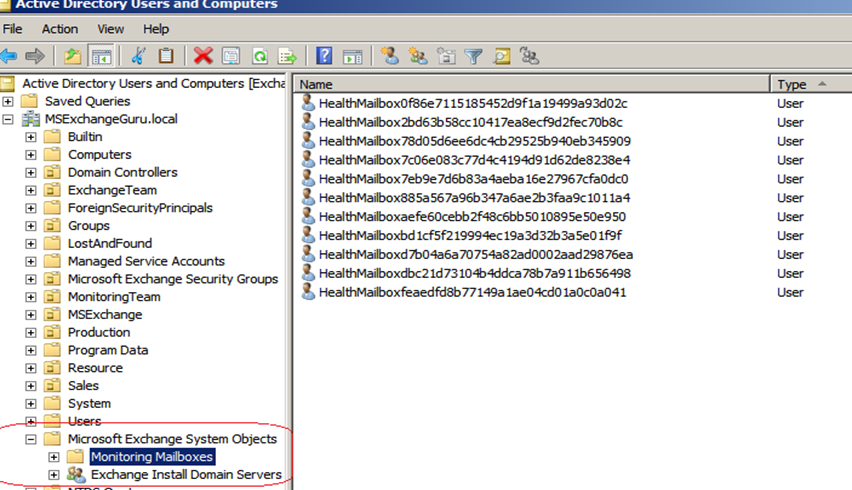
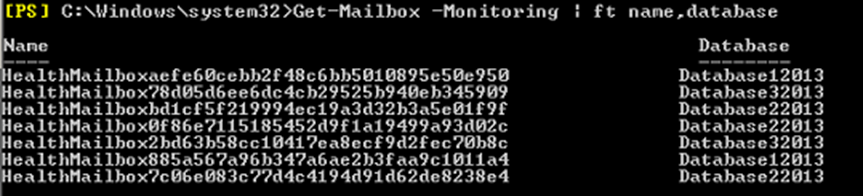
We can use the below command to see the monitoring mailboxes, if you want to see for the specific server then we can use the –server switch:
Get-mailbox –monitoring | ft name,database
Get-mailbox –monitoring –server Exchange13 | ft name,database
Server and Service Health:
Managed Availability has two clarifications of health namely Health sets (internal views) and health Groups (external views).
Health Set is a group of probes, monitors and responders for a component which determine the health status. We can see the list of health sets using the command: Get-HealthReport –Server <Server Name>
Health Groups are exposed to MOM/SCOM for reporting purpose.
There are 4 primary health groups as below:
- Customer Touch Points -Components that affect real-time user interactions, such as protocols, or the Information Store
- Service Components -Components without direct, real-time user interactions, such as the Microsoft Exchange Mailbox Replication service, or the offline address book generation process (OABGen)
- Server Components -Physical resources of the server, such as disk space, memory and networking
-
Dependency Availability -Server’s capability to contact required dependencies, such as Active Directory, DNS, etc.
The state of the health group is depends on the health of the monitor within the groups. A health group can have one of the six states: Healthy, Degraded, Unhealthy, Repairing, Disabled or Unavailable.
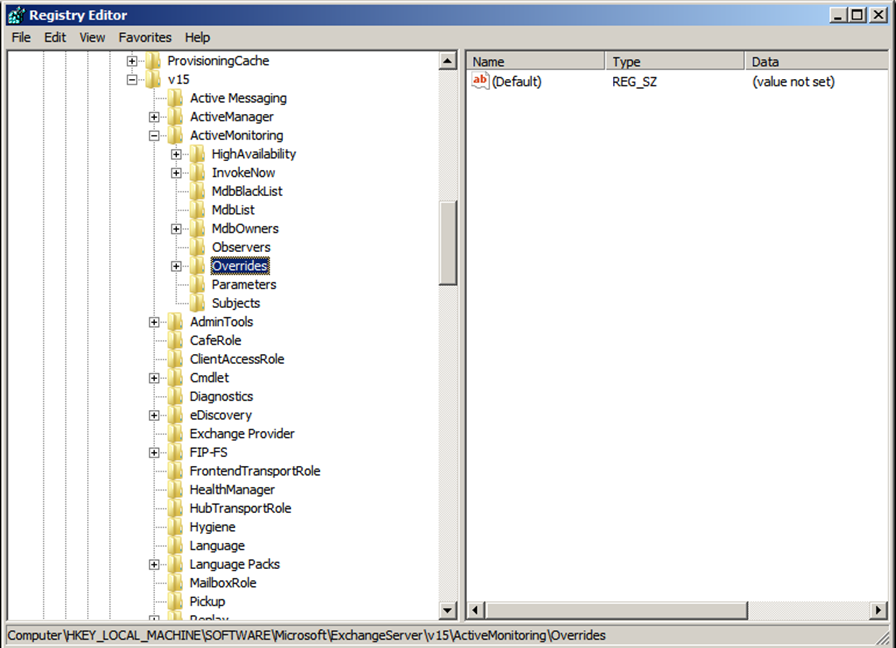
Overrides:
There are some situations, where in administrator has to override the actions performed by Managed Availability. Overrides can be deployed by Administrator to customize the Managed Availability as per the current requirements. The Overrides can be deployed specifically for the server or globally. If an override deployed for a server it will store under the registry and if the override deployed globally then it stored under active directory.
We can create the overrides in conditions as time based and server version based.
Time based override: Performing a system maintenance and administrator doesn’t want a specific action to takes place for 2-3 days; he can create a time based override. The maximum time we can specify is 60 days.
Version based Override: Administrator does not wants the recovery actions apply for indefinite time/ till the issue resolved, in such case he can create override based on the version of the server. Create an override and specify property apply version, the overrides will be affective till server version changes and it will not depend on the time duration.
NOTE:
- Exchange health service reads the configuration every 10 mins; hence the override will not implement immediately. The Global changes depend on the Active directory replication.
- Wildcards are not supported means cannot override entire health set in one task.
Few command used in Override as below:
Create an Override:
Add-ServerMonitoringOverride
Add-GlobalMonitoringOverride
In order to view the overrides use the command as ‘get’ and to remove use the command as ‘Remove’ with the same switches.
Ratish Nair
Microsoft MVP | Exchange Server
Team @MSExchangeGuru
")


June 8th, 2016 at 3:24 am
Hi Ritesh,
Thanks for putting up this blog in a lucid way to understand. I have one question. If I am not getting alerts on SCOM, which specific crimson channel logs on Exchange server I can look to confirm that Exchange server is reporting the alerts to SCOM.
In short, alerts picked by SCOM, where can those be spotted on Exchange server.
Thanks for your advise.
June 13th, 2016 at 3:32 am
It depends on the alert. Scom tells what is wrong.
July 27th, 2016 at 2:59 pm
This was an excellent write-up for this, greatly appreciated!
March 7th, 2017 at 4:31 am
Complicated Stuff made easy. good approach. Highly appreciated Ratish.
June 20th, 2017 at 3:39 am
[…] Managed Availability in Exchange Server 2013 […]