Learning how to use Windows Server Performance Monitor
When you have an issue regarding the Performance of the windows servers there are many factors that may cause this issue.
There are some parameters that should be checked as below:
-
CPU:
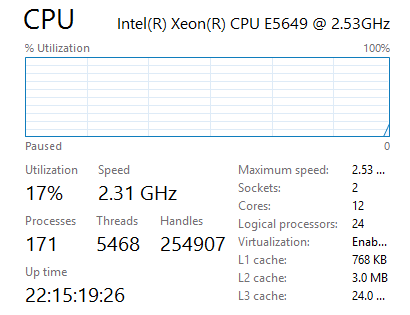
Using Task manager for real time monitoring
-
You can check the current CPU utilization

-
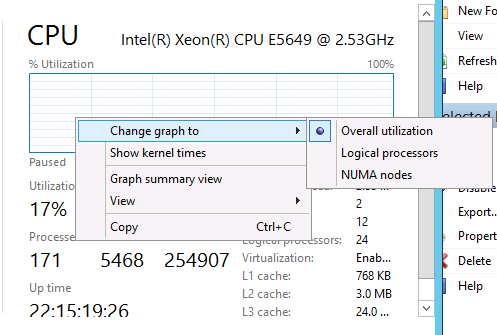
You can also check the logical processors by change graph to logical processors

-
- The overall usage on any individual core should be considered high when sustained values on a core are above 80%.
Using Performance monitor:
You should check the important counters:
- Counter name: Processor(_Total)% Processor Time
Description: Shows the percentage of time that the processor is executing application or operating system processes. This is when the processor isn’t idle.
Threshold: Should be less than 75% on average.
-
Counter name: Processor(_Total)% User Time
Description: Shows the percentage of processor time spent in user mode. User mode is a restricted processing mode designed for applications, environment subsystems, and integral subsystems
Threshold: Should remain below 75%.
-
Counter name: Processor(_Total)% Privileged Time
Description: Shows the percentage of processor time spent in privileged mode. Privileged mode is a processing mode designed for operating system components and hardware-manipulating drivers. It allows direct access to hardware and all memory.
Threshold: Should remain below 75%.
-
Counter name: Process(*)% Processor Time
Description: Shows the percentage of elapsed processor time that all process threads used to execute instructions. An instruction is the basic unit of execution in a computer. A thread is the object that executes instructions, and a process is the object created when a program is run. Code executed to handle some hardware interruptions and trap conditions are included in this count.
-
Counter name: SystemProcessor Queue Length (all instances)
Description: Indicates the number of threads each processor is servicing. Processor Queue Length can be used to identify if processor contention or high CPU utilization is caused by the processor capacity being insufficient to handle the workloads assigned to it. Processor Queue Length shows the number of threads that are delayed in the Processor Ready Queue and are waiting to be scheduled for execution. The value listed is the last observed value at the time the measurement was taken.
Threshold: Shouldn’t be greater than 5 per processor.
-
Memory:
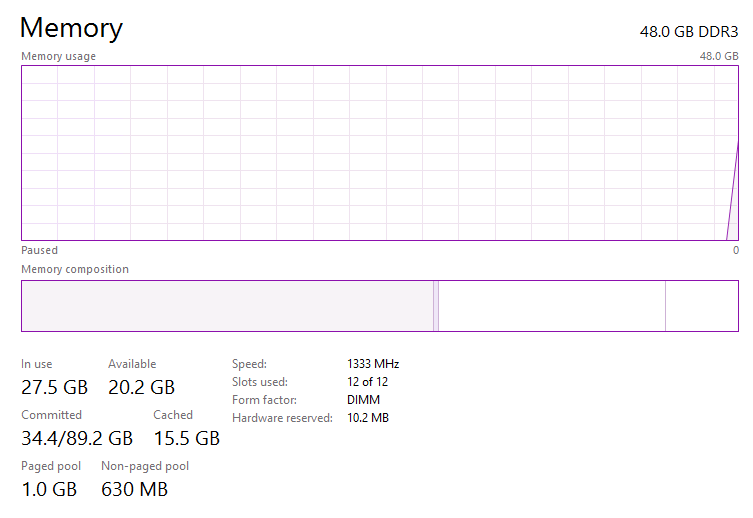
Using Task manager for real time monitoring

Using Performance monitor:
You should check the important counters:
- Process(*)Private Bytes
- Process(*)Virtual Bytes
- Process(*)Working Set
- Process(*)Handle Count
- Kernel memory is used in paged pool and non-paged pool. Long term monitoring can be performed on the host as a whole to determine memory leaks
- Memory(*) Pool Paged Bytes
- Memory(*)Pool Non Paged Bytes
- Memory (*)Available Mbytes – Should remain above 100 MB at all times.
- Memory(*)Committed Bytes
-
Disk
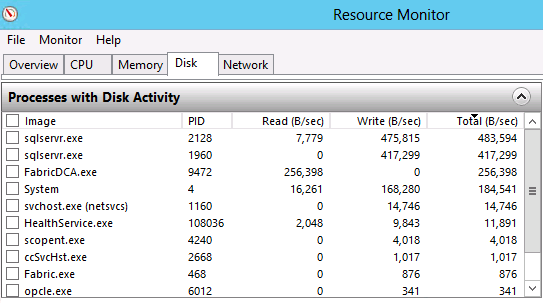
Using Task manager for real time monitoring; Open Resource manager

Using Performance monitor:
You should check the important counters:
- Avg. Disk sec/Transfer – Measures the amount of time it takes from when the Server sends an I/O request until it gets the response back
-
Avg Disk sec/Read and Avg Disk sec /Write – break down the transfers to read and write operations if the overall transfer appears slow
- 1ms to 15ms = Healthy
- 15ms to 25ms = Warning or Monitor
- 26ms or greater = Critical or Out of Spec
- 1ms to 15ms = Healthy
-
Avg. Disk Queue Length – how much queuing is occurring on due to the disk being busy
- 2 or under = Healthy
- 3-31 = Warning or Monitor. A possible issue, check read or write latency to confirm.
- 32 or higher = A likely issue, check read or write latency to confirm.
- 2 or under = Healthy
Ratish Nair
Microsoft MVP | Office Servers and Services
Team @MSExchangeGuru


